


The most popular BI tools nowadays are Power BI and Tableau, or if you prefer Microsoft and Salesforce, but why they are so popular?
The tools solve a problem: data viz. While in the past everything was done with Excel, the data viz start to be the solution to answer questions using the principle: when we see is more easy to decide.
Power BI
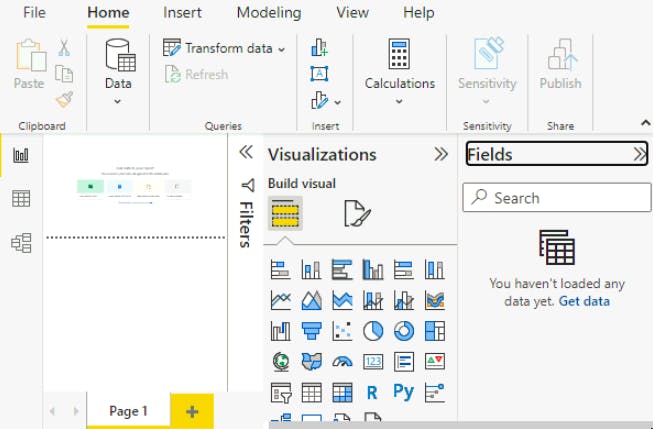
You can connect your data from different search like SQL and Excel, but the csv still the most used. You can use live connection or just upload your data to be analysed. The Power BI have 3 main division to consider: Report, where you will build your data viz, Data, where you will do the clean and transformation, and Model, where you will connect your tables following the same principle than SQL, connecting by same key (similar column).
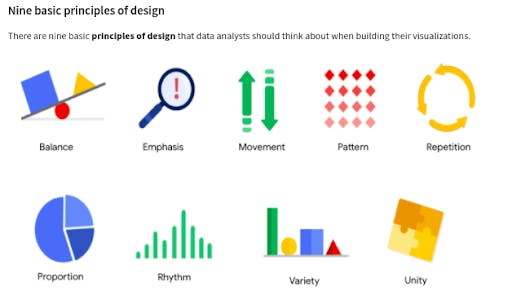
Different from Tableau that suggest the better chart for you, in Power BI you need to choose, and have a lot option, so before to choose one, is better to know what you want to answer, this site gives you the start point, the principle to be used will be the same for any data viz tool: balance, emphasis, movement, pattern, repetition, proportion, rhythm, variety and unity.
Tableau
Different from Power BI that have the Power Query just for clean and transformation, that part you must handle outside. The good part is that you choose your column and "Show Me" button will get you the best chart option.
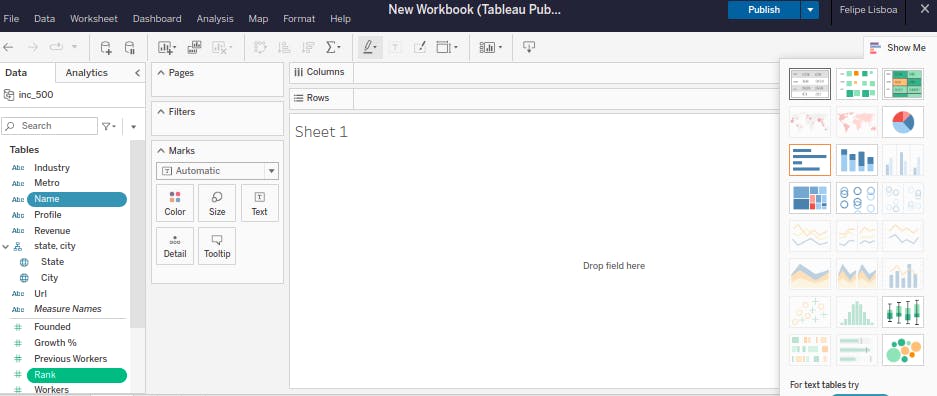
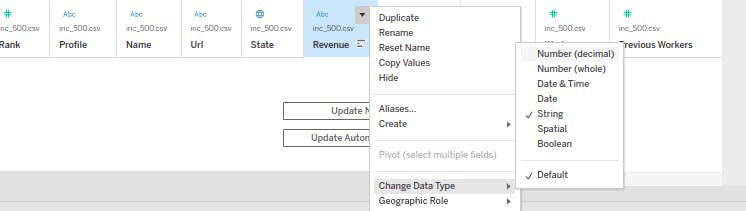
Like Power BI, with Tableau you can join tables and it's a good practice to choose the right data type before to start to work with the carts.
Measures
The part of the analytics that you must put your hands dirty will be to create the measures, could be a simple one like SUM the values of a column, or even the more complicate using IF/ELSE function.
To build measure with Tableau you will use SQL, while with Power BI they have specific language to that: DAX, the principle will be the same: what question you want to answer, and this answer will be in your visualization.
Below some Cheat Sheet that you help to start, I will leave the Power Query tool from Power BI for other day, in advance I can tell that is the better tool for data transformation that I have the pleasure to work with.